How does ExcelCompiler work?
Introduction
ExcelCompiler (formerly FastMC) is a software tool developed
and published by Ogee Group LLC to translate a cell formula,
such as “=SUM(A1:A10)”, into a VBA procedure performing the
same calculation. Excel Compiler will also translate the
formulas of all necessary precedent cells that determine a
compiled cell’s value. When any random number “RAND()” is
encountered, Excel Compiler generates a procedure for Monte
Carlo simulations.
Potential uses of Excel Compiler include:
- Simplifying complex spreadsheets by replacing certain groups of cells with VBA functions.
- Hiding specific proprietary calculations inside VBA functions (combined with password protection of VBA modules).
- Hiding specific proprietary calculations inside VBA functions (combined with password protection of VBA modules).
A simple example
Any cell in an Excel spreadsheet can either have its own,
independent value, or be a function of several input values
from several precedent cells. The values in these cells in
turn may be both the input and output of several functions
in other cells. Take the following sequence of cell
functions as an example:
Figure 1: a simple three-step calculation
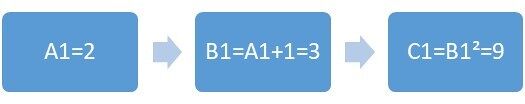
Here, A1 is a single input cell, C1 is the output cell, and
B1 is an intermediate calculation step. Accordingly, Excel
Compiler would write a VBA function that takes a single
input parameter with a default value of 2, replicates the
successive calculation steps, and returns the result:
Function MyCell(Optional R1C1 = 2#)
…
cells.Cell(0) = R1C1
cells.Cell(1) = R1C1 + 1
cells.Cell(2) = cells.Cell(1) ^ 2
MyCell = cells.Cell(2)
End Function
Directed graphs
Figure 2: complex hierarchy of interdependent cells
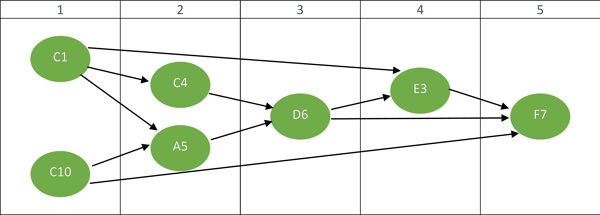
Here, finding the successive calculation steps from input
values to the final output value is not immediate (give it a
try!). In yet more complex scenarios, this task can prove
quite difficult for a human being. To help find these steps,
Excel provides the “Trace Precedents” and “Trace Dependents”
commands in its “Formulas” tab.
In order to write a VBA procedure that replicates the
calculation of the output cell with its intermediate steps
in correct order, Excel Compiler relies on the concept of
directed graph. In mathematics, a directed graph is a set of
nodes connected by edges (i.e. lines) that have a direction.
Here, nodes are cell values, and directed edges represent
formula dependencies. This is the directed graph
corresponding to our last example:
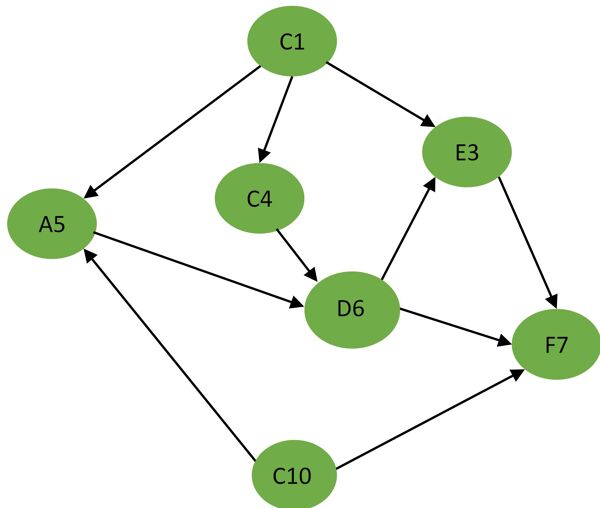
Figure 3: directed graph corresponding to Fig. 2
Note that a directed graph only represents the directional
flow of calculation steps in an abstract way. It does not
solve the problem of finding the logical order of the steps
from input to final output. To do so, Excel Compiler deploys
a
proprietary algorithm [Patent Pending]
that assigns a rank to each cell. Cells of lowest rank must
be computed first, then cells of second lowest rank, and so
on until the final output cell which has the highest rank.
This ranking algorithm provides an orderly flow of
calculation that respects the dependencies between nodes. In
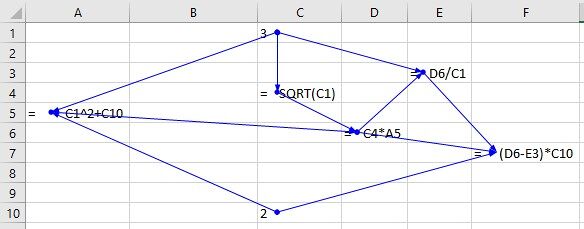
our example:
Figure 4: directed graph after ranking
Cells are then “bucketed” by rank, where each bucket
corresponds to a stage in the sequence of calculations.
Within any given bucket, the particular sub-order of
calculation does not matter. In our example, C10 may be
calculated before C1, and A5 may be calculated before C4;
however, both C1 and C10 must be calculated before C4 and
A5.
Graph theory is particularly interested in cycles. In Excel,
cycles are known as circular references: for example, if the
formula for cell A1 is “=B1” and vice-versa. Circular
references are typically disallowed and Excel Compiler would
fail in their presence.
Code generation
After ranking the cells, Excel Compiler transcribes the
individual cell functions into VBA code. Each function can
take as its input the values of lower-ranked cells, until
the final output in this sequence of calculations is
produced. The full code for Example 1 is given below:
Function MyCell(Optional R1C1 = 2#)
Dim cells As New CellSet, c As String
c = "R1C1 R1C2 result"
cells.Define c
cells.Cell(0) = R1C1
cells.Cell(1) = R1C1 + 1
cells.Cell(2) = cells.Cell(1) ^ 2
MyCell = cells.Cell(2)
End Function
Note that Excel Compiler uses the R1C1 reference style to
label cells. Here we have a function that takes a single
input parameter corresponding to cell R1C1 (A1), creates a
data structure for all three cells needed for the
calculation (the graph nodes), and then performs the
successive calculations before returning the result.
Additionally, Excel Compiler can deal with cell ranges which
require additional initialization instructions, and will
automatically switch to Monte Carlo mode whenever a random
number (“RAND()”) is encountered in any cell formula.
In Monte Carlo mode, Excel Compiler embeds the relevant
calculation instructions within a loop. Each step of the
loop simulates a new value of the output cell which
contributes to the average. Continuing Example 1, if we
replace the value of A1 with the formula “=RAND()” and run
Excel Compiler, we obtain the following code:
Sub MyCell(nSim As Long)
Dim i As Long, avg As Double, cells As New
CellSet, t As Single, c As String
t = Timer
c = "R1C1 R1C2 result"
cells.Define c
For i = 1 To nSim
cells.Cell(0) = Rnd
cells.Cell(1) = cells.Cell(0) +
1
cells.Cell(2) = cells.Cell(1) ^
2
avg = avg + cells.Cell(2) / nSim
Next i
MsgBox "Average = " & avg & "
calculated in " & Format(Timer - t, "Standard") & "
seconds", vbOKOnly, "MyCell"
End Sub
We can see that the generated code is similar, but with some
important differences. First, in Monte Carlo mode, Excel
Compiler creates a subroutine rather than a function. This
is because large Monte Carlo simulations can take a long
time to calculate and should not be invoked from a
spreadsheet function, especially when the spreadsheet is in
automatic calculation mode.
Second, the calculation steps are now embedded in a for loop
whose number of iterations is passed to the subroutine as a
parameter (nSims). An additional variable (avg) keeps track
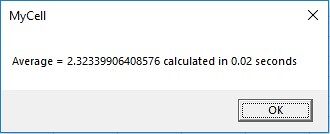
of the average simulated value. Finally, once the loop is
completed, the average value is displayed in a dialog box
together with the calculation time:
Figure 5: message displaying Monte-Carlo simulation average